
As we noted in a previous blog post, A/B testing your online donation forms can be a powerful practice, especially when you integrate those tests with the Salesforce Nonprofit Success Pack. In this step-by-step recipe, we'll create a report and dashboards in Salesforce that will allow you to quickly analyze which form in your A/B test is performing best with respect to one-time vs. sustaining donations.
For more background on this recipe, a host of other metrics, and specifics on the A/B testing process, watch our webinar, Six Ways to Get Smarter with Your 2018 Fundraising.
Objective
Create a custom Report in the Salesforce Nonprofit Success Pack that compares online donation form A/B test results for one-time and sustaining donations
Estimated Time
30 - 45 minutes
Requirements
- Salesforce Nonprofit Success Pack
- Use of the Donations (aka Opportunities) object to track donations
- Use of an online donation service that allows for the creation of multiple donation pages and associate each with a Campaign in Salesforce. Learn more >>
- Use of Campaign Hierarchies to organize A/B testing Campaigns Learn more >>
- Use of Google Analytics or a similar service for the creation of Experiments to setup the A/B test online. Learn more >>
- Rudimentary familiarity with creating custom fields and Reports in Salesforce
- Recurring Donation Amount custom field outlined in Step One of Display recurring donation data on Salesforce Contacts using User Defined Rollups in the NPSP Salesforce how-to recipe. NOTE: You do not need to create the other custom fields or User Defined Rollups noted in that recipe for the purposes of this project.
Desired Outcomes
Easily view and compare the performance of individual online donation forms in an A/B test across different metrics. This how to focuses on evaluating performance of A/B test donation forms with respect to one-time vs. recurring donations.
The End Result
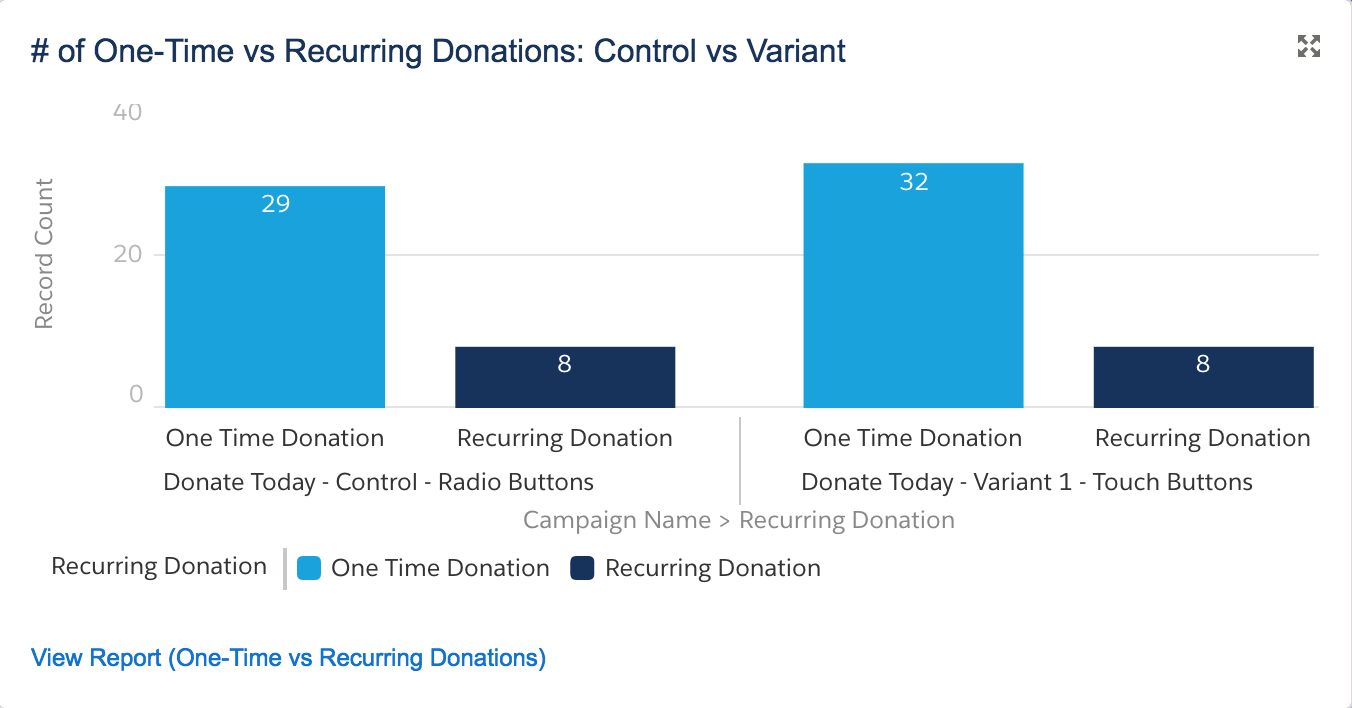
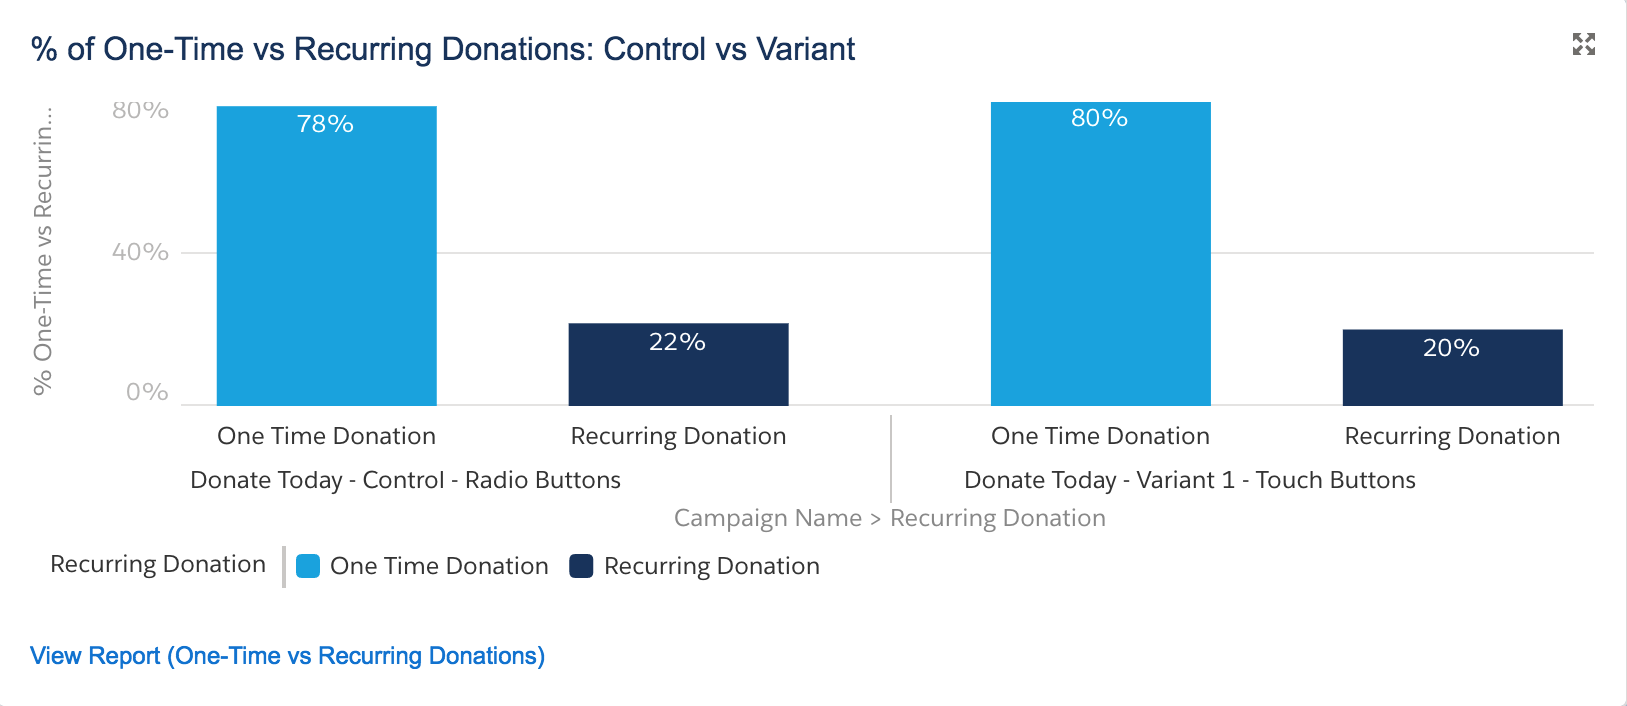
The charts above are based on one Custom Report of the Report Type "Campaigns with Opportunities." Depending on the chart, the light blue bar shows either the number or percentage of one-time donations per campaign. The dark blue bar shows either the number or percentage of recurring donations per campaign. One campaign represents the original (control) donation form and the other campaign represents the slightly modified (variant) donation form.
These charts show that the slight modification of using touch buttons in the variant donation form brought in slightly more one-time donations and slightly less recurring donations than the control donation form, which uses radio buttons, suggesting that the slight modification in the variant donation form might be more effective in bringing in one-time donations but not as effective in bringing in recurring donations. An A/B test involving hundreds or thousands of visitors would pronounce these differences and more meaningfully show which version of the form performs better in reality.
{loadposition blog-ad-general}Step One: Create a Custom Report
The Custom Report with the chart we want needs to distinguish between one-time and recurring closed/won Opportunities in each Campaign in the A/B test. To create our Report:
- Go to the Reports tab
- Click New Report
- For Select Report Type, choose Campaigns with Opportunities
- Click Create
- For Show, confirm "All Opportunities" is selected
- For Date Field > Range, select "All Time"
- Click Add next to Filters. In the new Filter form that appears:
- Choose "Won" from the field drop down
- Select "Equals" for the operator
- Enter "True" in the text field
- Click Add next to Filters again:
- Choose Parent Campaign Name from the field drop down
- Select Equals for the operator
- Enter the name of the parent campaign containing each sub-campaign in your A/B test.
- Click OK
- Next to the Preview Header, click Summary Format
- Drag and drop the Campaign Name field to where it says "Drop a field here to create a grouping"
- Drag and drop Add Bucket Field to where it says "Drop a field here to create a grouping" in the area right below the Campaign Name grouping.
- Enter the following values in the popup window:
- Source Column: Recurring Donation Amount
- Bucket Field Name: Recurring Donation
- Under Define Ranges:
- For first row: Range = 0; Name: One-Time Donations
- For 2nd row: Range = 0; Name: Recurring Donations
- Check the box next to "Treat empty Recurring Donation Amount values in the report as zeros."
- Click OK
- Click Save and enter in the following values in the popup window
- Report Name: One-time vs Recurring Donations: Control vs Variant
- Report Unique Name: Onetime_vs_Recurring_Donations_Control_vs_Variant
- Report Description: Number and percentage of one-time and existing donors per Campaign
- For report Folder, select the folder of your choice
- Click Save
Step Two: Change your report to a Matrix Report and add in some trimmings
- Next to the Preview header, click Summary Format and Select Matrix
- Ensure that the Recurring Donation and Campaign Name fields are grouped in each axis of the matrix.
- Drag and Drop Add Formula to where it says "Drop Summarizable fields into the matrix."
- In the Custom Summary Formula Field popup, enter the values noted in the Report Formula Field table below, then click OK
- Drag and drop the Amount field to where it says "Drop Summarizable fields into the matrix."
- In the popup window, check the boxes for Amount and Average, then click OK
- Click Save
| Elements | Field Details |
|---|---|
| Column Name: Description: Format: Where will...?: Formula: |
% One-time vs Recurring Donations Percentage of one-time and recurring donations per Campaign Percent, 2 Decimals At a specific row/column grouping level... A: Campaign Name B: Recurring Donation RowCount / PARENTGROUPVAL(RowCount, CAMPAIGN_NAME, COLUMN_GRAND_SUMMARY) |
Step Three: Modify the Report's Chart
To create the chart noted above in Lightning, edit the default chart as follows:
- Select Type: Vertical Bar Chart
- Y-Axis: % One-time vs Recurring Donations
- X-Axis: Campaign Name
- Group By: Recurring Donation
- Formatting > Chart Title: One-time vs Recurring Donations
- Click OK
- Click Run Report
The chart displayed should parallel the chart above to show the percentage of one-time and recurring donations in each A/B Test Campaign. To view the number as opposed to percentage of new and old donors, simply change the Y-Axis value to Record Count. To view the Sum and Average of one-time and recurring donations per campaign, change the chart's Y-Axis value accordingly.
Step Four: Create a Custom Formula field to show the Projected Donation Amount
This report shows the value of one-time donations and the initial value of recurring donations in each Campaign within the A/B test. The Projected Donation Amount field includes recurring donations pledged in the future and allows for a more forward-looking picture of your A/B test Campaign. The Projected Donation Amount is a Custom Formula Field on the Opportunity object that displays the product of the Amount and Installments field in the related Recurring Donation record, if one exists for a particular Opportunity.
To create this field in Salesforce Classic:
- Go to Setup
- In the left column, click Customize
- Click Opportunities
- Click Fields
- In the Opportunity Custom Fields & Relationships section, click New
- For each step in the process, use the values in the Opportunity Object Custom Fields chart below to create the fields
| Elements | Field Details |
|---|---|
| Field Label: Field Name: Data Type: Formula: Treat Blank Fields as Zeroes: |
Projected Donation Amount Projected_Donation_Amount Formula (Currency) IF ( ISPICKVAL ( npe03__Recurring_Donation__r.npe03__Open_Ended_Status__c, "Open" ), npe03__Recurring_Donation__r.npe03__Amount__c * npe03__Recurring_Donation__r.npe03__Installments__c, Amount ) Ensure this is checked |
- Navigate back to the report and drag and drop your newly created field to where it says "Drop Summarizable fields into the matrix."
- Check the box for Sum, then click OK
- Change the chart's Y-Axis value accordingly to visually display the total Projected Donation Amount across each campaign for one-time and recurring donations.
Considerations
To keep from skewing the value of the Projected Donation Amount field in this report, you'll want to keep only the initial donation as part of the records included in the report since including subsequent Opportunities for the recurring donation will radically skew the numbers as future payments are closed won (e.g., Posted). To do so, you have a number of options:
- Do not associate the Opportunity for subsequent recurring donation payments with the Campaign of the initial recurring donation;
- If your A/B test is running for a month or less (e.g., a time period that would mean only the first donation of a recurring donation would have been processed), add a filter to the report to only include donations made during that period; or
- If you use the Soapbox Engage Donations app, add a filter to the report to exclude Opportunities with the Soapbox Recurring Donation Payment record type.
Next Steps
For more background on this recipe, specifics on the A/B testing process, examples of what to test, and an overview of UTM codes for inbound marketing metrics, watch our webinar, Six Ways to Get Smarter with Your 2018 Fundraising.
Supporting Resources
- WEBINAR RECORDING: Six Ways to Get Smarter with Your 2018 Fundraising
- BLOG POST: Six Ways to Get Smarter with Your 2018 Fundraising
- SALESFORCE HOW-TO BLOG POST: Track Online Donation Form A/B Test Results with Salesforce Campaign Hierarchies
- SALESFORCE HOW-TO BLOG POST: Create a Salesforce Report to Evaluate A/B Tests of Online Donation Forms for One-Time and Sustaining Donations
- SALESFORCE HOW-TO BLOG POST: Create a Salesforce Report to Evaluate A/B Tests of Online Donation Forms for New and Existing Donors
- SALESFORCE HOW-TO BLOG POST: Create a Salesforce Dashboard to Display A/B Test Results of Online Donation Forms