To understand how best to acquire new donors, it is important to determine what methods have been most successful in doing so already. This task is precisely why the Campaigns object exists in Salesforce. With it, you can define an unlimited number of efforts and associate Donation records with those efforts. From direct mailings to peer-to-peer fundraising to email appeals to individual online donation forms to much more, creating Campaigns for each can help you track their results.
This step-by-step recipe is an ode to the power of Campaign, demonstrating how you can create a chart that shows new donor acquisition by Primary Campaign Source so you can understand what's working - and what's not - for your nonprofit.
For other new donor Salesforce recipes along with a discussion of donor acquisition strategies, watch our free webinar, Win New Donors this End-of-Year Fundraising Season.
Objective
Create a custom Report in the Salesforce Nonprofit Success Pack with a chart that displays new donors acquired by Primary Campaign Source for the current year
Estimated Time
20 - 30 minutes
Requirements
- Salesforce Nonprofit Success Pack
- Use of the Donations (aka Opportunities) objects to track donations
- Use of Campaigns to track marketing efforts and associate Donations with those Campaigns
- Rudimentary familiarity with creating custom fields and Reports in Salesforce
- Is First Gift Ever custom field outlined in Step One of Chart New Donor Acquisition Cumulatively by Month during the Last 5 Years Salesforce how-to recipe
Desired Outcomes
- Chart new donor acquisition by Primary Campaign Source
- Calculate the average gift amount, largest gift amount, smallest gift amount, and total gifts for the first gift this year by new donors by Primary Campaign Source
The End Result
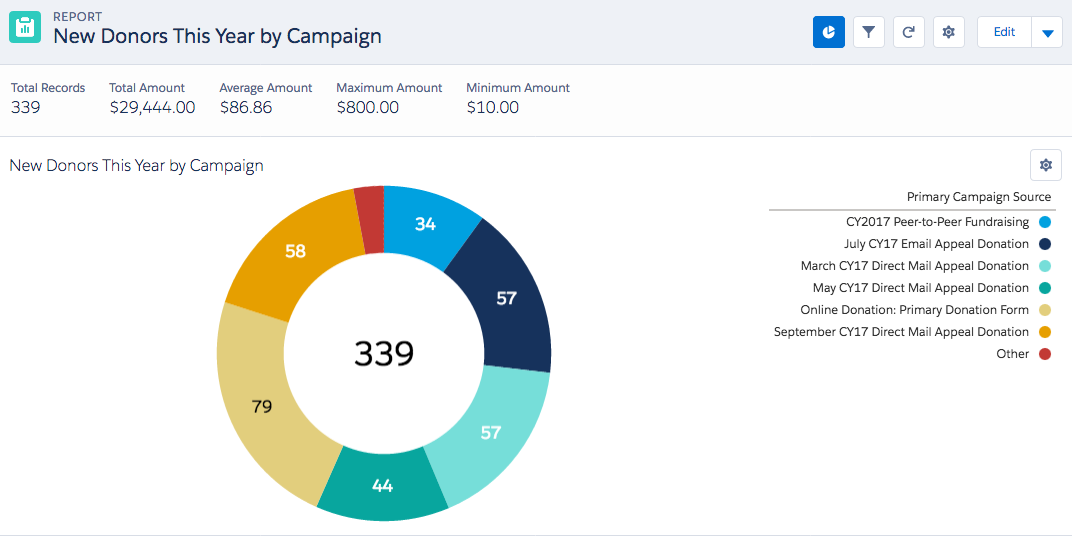
The above chart is from a custom Report on Opportunities and shows the breakdown of initial gifts from new donors for the current year by Primary Campaign Source. The report also contains statistics for donors' first gift of the current year, aggregated by Primary Campaign Source and shown for the entire report cohort at the top of the chart.
{loadposition blog-ad-general}Step One: Create a custom Report
With our Is First Gift Ever custom Opportunity field created in this earlier recipe, we can create our Report:
- Go to the Reports tab
- Click New Report
- For Select Report Type, choose Opportunities
- Click Create
- For Show, confirm "All Opportunities" is selected
- For Date Field > Range, select "Current CY"
- Add
- In the new Filter form that appears:
- Choose "Is First Gift of Year" from the field drop down
- Select "equals" for the operator
- Enter "true" in the text field
- Click OK
- Next, choose "Won" from the field drop down
- Select "equals" for the operator
- Enter "true" in the text field
- Click OK
- Click Save and enter in the following values in the popup window and click Save:
- Report Name: New Donors This Year by Campaign
- Report Unique Name: New_Donors_by_Primary_Campaign_Source
- Report Description: New donors this year by Primary Campaign Source
- For Report Folder, select the folder of your choice
- Click Save
Step Two: Change your Report to a Summary Report
- Next to the Preview header, click Tabular Format and select Summary
- Drag and drop the Primary Campaign Source field to where it says "Drop a field here to create a grouping."
- Hover over the Amount column heading and click the down arrow
- Click Summarize this field...
- Tick off all of the summary options
- Click Apply
- Save your report
Step Three: Modify the Report's chart
To finalize our Report chart in the screenshot above from Salesforce Lightning:
- Display As: Click Donut Chart
- Chart Title: New Donors This Year by Campaign
- Y-Axis: Record Count
- Show Values: check
Possible Additions or Modifications
With your Report now created, you can easily alter the timeframe to analyze and year or group of years you wish. This can be done in Salesforce Classic by editing the Report and changing the Date Field > Range or in the Salesforce Lightning Experience by altering the filter after the Report is run. This allows you to analyze previous years or multiple years to determine what Campaigns have worked best in acquiring new donors.
Next Steps
Watch our free webinar, Win New Donors this End-of-Year Fundraising Season, where we'll share additional ways the Salesforce Nonprofit Success Pack can drive new donor acquisitions and the smart strategy you can implement to ensure success.