
Successful new donor acquisition is one of the most challenging aspects of nonprofit fundraising. Key to success is a solid understanding of your current donor file so you can quantify past performance and set reasonable goals. With the Salesforce Nonprofit Success Pack, you have a firm foundation for that understanding as well as the ability to further customize reporting to give a full picture of your donors. In this step-by-step recipe, we'll create a chart that shows new donor acquisition cumulative by month for the last five years as well as toss in some helpful additional metrics.
For a full rundown of other new donor Salesforce recipes along with a presentation of new donor acquisition strategies, watch our free webinar, Win New Donors this End-of-Year Fundraising Season.
Objective
Create a custom Report in the Salesforce Nonprofit Success Pack with a chart that displays new donor acquisition cumulatively by month for the current year and the previous four years
Estimated Time
20 - 30 minutes
Requirements
- Salesforce Nonprofit Success Pack
- Use of the Donations (aka Opportunities) objects to track donations
- Rudimentary familiarity with creating custom fields and Reports in Salesforce
Desired Outcomes
- Chart new donor acquisition cumulative by month for the current year and the previous four years
- Calculate the average gift amount, largest gift amount, smallest gift amount, and total gifts for new donors for each year and each month in our reporting period
The End Result
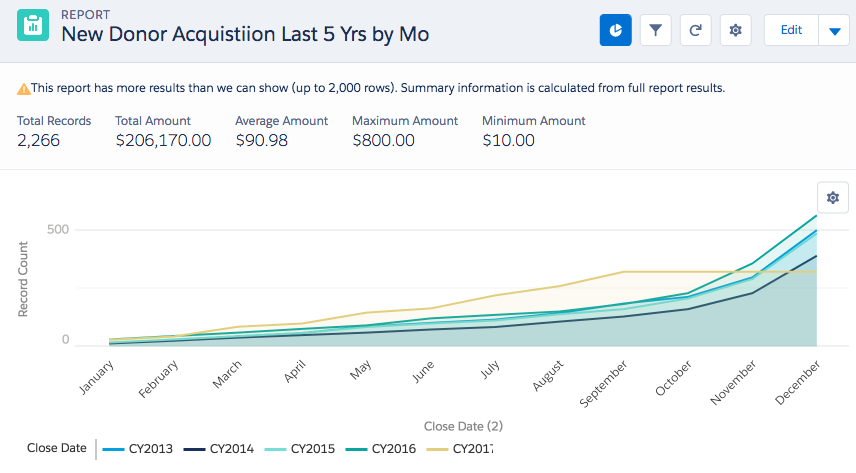
The above chart is from a custom Report on Opportunities and shows the cumulative number of new donors for the last five years by month. While this graph could have been created through a Report on the Contact object using the First Gift Date in the Salesforce Nonprofit Success Pack, we chose to use the Opportunity object to capture metrics at the top of the chart. These summarize the total number of new donors for the entire period, total given by new donors, average gift from new donors, and largest and smallest gift from new donors. The metrics are also calculated for each year and for each month in the Report.
{loadposition blog-ad-general}Step One: Create custom field on the Opportunity object
Since we're choosing to create our Report based on the Opportunity object so we can calculate additional metrics for our new donors and their donations, we need to determine which Opportunity records represent first donations from those new donors. Fortunately, the date of a Contact's first gift already exists in the Salesforce Nonprofit Success Pack in the First Gift Date field. We'll use that date in a new formula field on the Opportunity to determine if a given Opportunity record is the first. We'll also add in some logic so the field is only populated if the Opportunity is a donation. The formula below is specific to an NPSP instance using the NPSP Default record type and Soapbox Engage's Donations app for donation records. You can modify those record types to meet your needs.
To create this field in Salesforce Classic:
- Go to Setup
- In the left column, click Customize
- Click Opportunities
- Click Fields
- In the Opportunity Custom Fields & Relationships section, click New
- For each step in the process, use the values in the Opportunity Object Custom Fields chart below to create the fields
To create this field in Salesforce Lightning:
- Go to Setup
- Enter "Object" in the Quick Find box in left column
- Select Object Manager under the Objects and Fields menu
- Scroll down the list and click Opportunities
- Click Fields
- In the Opportunity Custom Fields & Relationships section, click New
- In the Fields & Relationship section, click New
- For each step in the process, use the values in the Opportunity Object Custom Fields chart below to create the fields
Opportunity Object Custom Fields
| Elements | Field Details |
|---|---|
| Field Label: API Name: Data Type: Formula: |
Is First Gift Ever Is_First_Gift_Ever__c Formula (Text) IF ( CloseDate = npsp__Primary_Contact__r.npo02__FirstCloseDate__c, IF ( OR (RecordType.Name = "Soapbox Donation", RecordType.Name = "Soapbox Recurring Donation", RecordType.Name = "NPSP Default"), "true", "false"), "false") |
Step Two: Create a custom Report
With our custom field in place, we can create our Report. To create our Report:
- Go to the Reports tab
- Click New Report
- For Select Report Type, choose Opportunities
- Click Create
- For Show, confirm "All Opportunities" is selected
- For Date Field > Range, select "All Time"
- Add
- In the new Filter form that appears:
- Choose "Is First Gift Ever" from the field drop down
- Select "equals" for the operator
- Enter "true" in the text field
- Click OK
- Next, choose "Won" from the field drop down
- Select "equals" for the operator
- Enter "true" in the text field
- Click OK
- Next, choose "Close Date" from the field drop down
- Select "equals" for the operator
- Enter "THIS YEAR" in the text field
- Click OK
- Next, choose "Close Date" from the field drop down
- Select "equals" for the operator
- Enter "LAST 4 YEARS" in the text field
- Click OK
- Click Filter > Add > Filter Logic
- Modify the Filter Logic field to be "1 AND 2 AND (3 OR 4)"
- Click OK
- Click Save and enter in the following values in the popup window and click Save:
- Report Name: New Donor Acquisition Last 5 Yrs by Mo
- Report Unique Name: New_Donor_Acquisition_Last_5_Yrs_by_Mo
- Report Description: Monthly cumulative total of new donor donors over the last five years
- For Report Folder, select the folder of your choice
- Click Save
Step Three: Change your Report to a Matrix Report and add in some trimmings
- Next to the Preview header, click Tabular Format and select Matrix
- Drag and drop the Close Date (2) field to where it says "Drop a field here to create a column grouping."
- Hover over your new Close Date (2) group and click the down arrow
- For Group Dates By, select Calendar Year
- Drag and drop the Close Date field to where it says "Drop a field here to create a row grouping."
- Hover over your new Close Date group and click the down arrow
- For Group Dates By, select Calendar Month in Year
- Click OK
- Save
Step Four: Modify the Report's chart
As a reminder from earlier, we're after the following as our Report chart, as seen in Salesforce Lightning:
To achieve this, edit the default chart as follows:
- Display As: Click Line Chart
- Chart Title: New Donor Acquisition Last 5 Yrs by Mo
- Y-Axis: Record Count
- Cumulative: check
- Add: Group
Next Steps
Watch our free webinar, Win New Donors this End-of-Year Fundraising Season, where we'll share additional ways the Salesforce Nonprofit Success Pack can drive new donor acquisitions and the smart strategy you can implement to ensure success.