Donor retention is a supremely vital metric by which fundraisers determine success. Visualizing progress toward an organization's goal throughout the year with the proper context is critical to understanding your own donor retention. In this recipe, we roll up our sleeves to walk you through - step-by-step - the creation of a custom Report in the Salesforce Nonprofit Success Pack that will chart both that progress and that context.
For a full breakdown of other donor retention Salesforce recipes as well as a presentation of proven donor retention fundraising strategy, watch our webinar, Achieve Dynamite Donor Retention with the Salesforce Nonprofit Success Pack. A more productive 45 minutes focused on fundraising and the Salesforce Nonprofit Success Pack, you will not find.
Objective
Create a custom Report in the Salesforce Nonprofit Success Pack with a chart that displays the donor retention rate for this year cumulatively by month vs. the acquisition of that donor cohort in the previous year by month compared to the donor retention goal for the current year
Estimated Time
50 - 70 minutes
Requirements
- Salesforce Nonprofit Success Pack
- Use of the Donations (aka Opportunities) objects to track donations
- Rudimentary familiarity with creating custom fields and Reports in Salesforce
Desired Outcomes
- Chart donor retention for the current year as a cumulative percentage month by month
- For the donor cohort used to calculate donor retention for the current year, chart the cumulative percentage of their acquisition the previous year
- Display the donor retention goal as a line on the chart
- Display the total number of donors in the cohort on the chart
The End Result
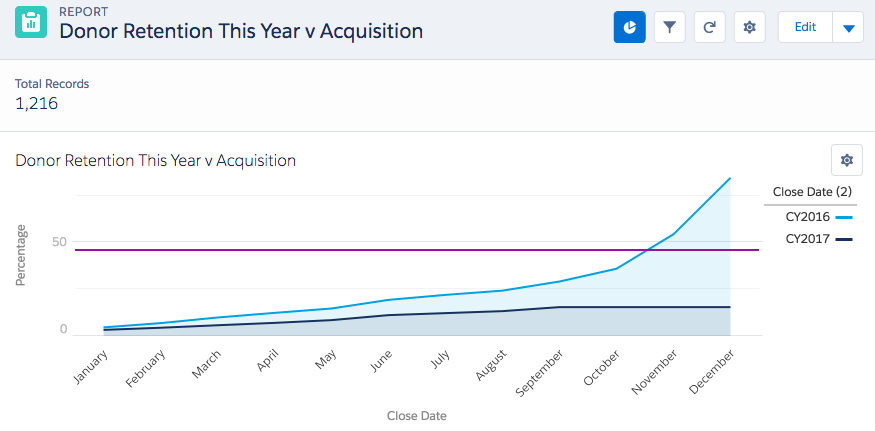
The above chart is from a custom Report on Opportunities and it's the holy grail of donor retention reporting we seek. The light blue line shows the month by month acquisition of our donor retention cohort from last year. The dark gray line shows the month by month cumulative donor retention percentage for the current year. The Report was run in September 2017 which is why the cumulative percentage doesn't increase beyond that point in the year. The total number of donors in our cohort is shown in the upper left corner, or 1,216.
The purple line shows our donor retention goal for 2017, or 46%. By hovering over the highest point in the 2017 donor retention line, we see that current donor retention as of September is only 15%, or a full 31% under our goal. All is not lost, though. As can be seen in the chart, initial acquisition of this cohort in 2016 saw a massive spike in giving through October, November, and December. Assuming that giving patterns are consistent from one year to the next, we should expect to see a significant rise in our donor retention line - provided we use the right fundraising strategy, of course!
{loadposition blog-ad-general}Step One: Create custom fields on the Contact object
In order to create the Report with the chart we've after, we need to be able to include a) only Opportunities for Contacts who gave in 2016; and b) only the first donation for a given Contact in 2016, and in 2017, if they've given this year. We'll be able to take care of the first part of that filter using a field in the Nonprofit Success Pack. For the second, we need to cook up some special sauce using custom fields on the Contact and Opportunity objects as well as some User Defined Rollups in the NPSP. Let's start with the custom fields on the Contact object which will serve as target fields for our User Defined Rollups.
The fields we'll create are in the chart below. Only the first two are required for our Report. The others are to facilitate additional Reports you may want to create for previous years. Feel free to skip those if you're only interested in the current year.
To create these fields in Salesforce Classic:
- Go to Setup
- In the left column, click Customize
- Click Contacts
- Click Fields
- In the Contact Custom Fields & Relationships section, click New
- For each step in the process, use the values in the Contact Object Custom Fields charts below to create the fields
- Repeat until all fields are added
To create these fields in Salesforce Lightning:
- Go to Setup
- Enter "Object" in the Quick Find box in left column
- Select Object Manager under the Objects and Fields menu
- Scroll down the list and click Contacts
- Click Fields
- In the Contact Custom Fields & Relationships section, click New
- In the Fields & Relationship section, click New
- For each step in the process, use the values in the Contact Object Custom Fields charts below to create the fields
- Repeat until all fields are added
Contact Object Custom Fields
| Elements | Field Details |
|---|---|
| Field Label: API Name: Data Type: |
First Gift Date This Year First_Gift_Date_This_Year__c Date |
| Field Label: API Name: Data Type: |
First Gift Date Last Year First_Gift_Date_Last_Year__c Date |
| Field Label: API Name: Data Type: |
First Gift Date Two Years Ago First_Gift_Date_Two_Years_Ago__c Date |
| Field Label: API Name: Data Type: |
First Gift Date Three Years Ago First_Gift_Date_Three_Years_Ago__c Date |
| Field Label: API Name: Data Type: |
First Gift Date Four Years Ago First_Gift_Date_Four_Years_Ago__c Date |
| Field Label: API Name: Data Type: |
First Gift Date Four Years Ago First_Gift_Date_Four_Years_Ago__c Date |
Step Two: Create custom fields on the Opportunity object
With our Contact source fields created, let's create the source fields on the Opportunity object from which our rollup data will come. As with the Contact fields, you can exclude any fields for years prior to last year if you don't wish to create versions of the Report for previous years.
To create these fields in Salesforce Classic:
- Go to Setup
- In the left column, click Customize
- Click Opportunities
- Click Fields
- In the Opportunity Custom Fields & Relationships section, click New
- For each step in the process, use the values in the Opportunity Object Custom Fields charts below to create the fields
- Repeat until all fields are added
To create these fields in Salesforce Lightning:
- Go to Setup
- Enter "Object" in the Quick Find box in left column
- Select Object Manager under the Objects and Fields menu
- Scroll down the list and click Opportunities
- Click Fields
- In the Opportunity Custom Fields & Relationships section, click New
- In the Fields & Relationship section, click New
- For each step in the process, use the values in the Opportunity Object Custom Fields charts below to create the fields
- Repeat until all fields are added
Opportunity Object Custom Fields
| Elements | Field Details |
|---|---|
| Field Label: API Name: Data Type: Formula: |
Gift Date If This Year Gift_Date_If_This_Year__c Formula (Date)
IF ( YEAR (CloseDate) = ( YEAR (TODAY()) ), CloseDate, NULL) |
| Field Label: API Name: Data Type: Formula: |
Gift Date If Last Year Gift_Date_If_Last_Year__c Formula (Date)
IF ( YEAR (CloseDate) = ( YEAR (TODAY()) - 1 ), CloseDate, NULL) |
| Field Label: API Name: Data Type: Formula: |
Gift Date If Two Years Ago Gift_Date_If_Two_Years_Ago__c Formula (Date)
IF ( YEAR (CloseDate) = ( YEAR (TODAY()) - 2 ), CloseDate, NULL) |
| Field Label: API Name: Data Type: Formula: |
Gift Date If Three Years Ago Gift_Date_If_Three_Years_Ago__c Formula (Date)
IF ( YEAR (CloseDate) = ( YEAR (TODAY()) - 3 ), CloseDate, NULL) |
| Field Label: API Name: Data Type: Formula: |
Gift Date If Four Years Ago Gift_Date_If_Four_Years_Ago__c Formula (Date)
IF ( YEAR (CloseDate) = ( YEAR (TODAY()) - 4 ), CloseDate, NULL) |
| Field Label: API Name: Data Type: Formula: |
Gift Date If Five Years Ago Gift_Date_If_Five_Years_Ago__c Formula (Date)
IF ( YEAR (CloseDate) = ( YEAR (TODAY()) - 5 ), CloseDate, NULL) |
| Field Label: API Name: Data Type: Formula: |
Is First Gift of Year Is_First_Gift_of_Year__c Formula (Text) IF ( OR (
CloseDate = npsp__Primary_Contact__r.First_Gift_Date_This_Year__c,
CloseDate = npsp__Primary_Contact__r.First_Gift_Date_Last_Year__c,
CloseDate = npsp__Primary_Contact__r.First_Gift_Date_Two_Years_Ago__c,
CloseDate = npsp__Primary_Contact__r.First_Gift_Date_Three_Years_Ago__c,
CloseDate = npsp__Primary_Contact__r.First_Gift_Date_Four_Years_Ago__c,
CloseDate = npsp__Primary_Contact__r.First_Gift_Date_Five_Years_Ago__c ),
"true",
"false") |
Step Three: Create User Defined Rollups
Next, we'll create our User Defined Rollups in the NPSP. To do so:
- In the Nonprofit Success Pack app, click the NPSP Settings tab
- Click Donations
- Click User Defined Rollups
- Click New User Defined Rollup
- Use the table below, enter the appropriate values
- Click Save
- Repeat until all rollups are added
User Defined Rollups
| Opportunity Field | Rollup Operation | Target Object | Target Field |
|---|---|---|---|
| Gift Date If This Year | MIN | Contact | First Gift Date This Year |
| Gift Date If Last Year | MIN | Contact | First Gift Date Last Year |
| Gift Date If Two Years Ago | MIN | Contact | First Gift Date Two Years Ago |
| Gift Date If Three Years Ago | MIN | Contact | First Gift Date Three Years Ago |
| Gift Date If Four Years Ago | MIN | Contact | First Gift Date Four Years Ago |
| Gift Date If Five Years Ago | MIN | Contact | First Gift Date Five Years Ago |
Step Four: Create a custom Report
With our custom fields and User Defined Rollups created, we can create our Report. To create our Report, go to the Reports tab and click New Report fields in Salesforce Classic:
- Go to the Reports tab
- Click New Report
- For Select Report Type, choose Opportunities
- Click Create
- For Show, confirm "All Opportunities" is selected
- For Date Field > Range, select "Current and Previous CY"
- For Date Field > Range, select "All Time"
- Add
- In the new Filter form that appears:
- Choose "Is First Gift of Year" from the field drop down
- Select "equals" for the operator
- Enter "true" in the text field
- Click OK
- Next, choose "Opportunity Record Type" from the field drop down
- Select "equals" for the operator
- Click the magnifying glass and select all Opportunity Record Types used to track donations
- Click OK
- Click Save and enter in the following values in the popup window and click Save:
- Report Name: Donor Retention This Year v Acquisition
- Report Unique Name: Donor_Retention_This_Year_v_Acquisition
- Report Description: Monthly cumulative rate of donor retention this year vs. monthly cumulative rate of donor acquisition last year
- For Report Folder, select the folder of your choice
- Click Save
Step Five: Take a break
Stand up. Stretch. Get a drink of water. Listen to some tunes. You've done some good work so far. We want you fresh and focused for the homestretch.
Step Six: Change your Report to a Matrix Report and add in some trimmings
- Next to the Preview header, click Tabular Format and select Matrix
- Drag and drop the Close Date (2) field to where it says "Drop a field here to create a column grouping."
- Hover over your new Close Date (2) group and click the down arrow
- For Group Dates By, select Calendar Year
- Drag and drop the Close Date field to where it says "Drop a field here to create a row grouping."
- Hover over your new Close Date group and click the down arrow
- For Group Dates By, select Calendar Month in Year
- Drag and drop Add Formula to where it says "Drop summarizable fields into the matrix."
- In the Custom Summary Formula Field popup, enter the values noted in the Report Formula Field table below
- Click OK
- Save
Report Formula Field
| Elements | Field Details |
|---|---|
| Column Name: Description: Format: Where will...?: Formula: |
Percentage Percentage of Total Donors Percent, 2 Decimals At a specific row/column grouping level... A: Close Date (by Calendar Month in Year) B: Close Date (2) (by Calendar Year) RowCount / PARENTGROUPVAL(RowCount, ROW_GRAND_SUMMARY, COLUMN_GRAND_SUMMARY) |
Step Seven: Modify the Report's chart
As a reminder from earlier, we're after the following as our Report chart, as seen in Salesforce Lightning:
To achieve this, edit the default chart as follows:
- Display As: Click Line Chart
- Chart Title: Donor Retention This Year v Acquisition
- Y-Axis: Percentage
- +Show Reference Line: check
- Reference Line Value: enter your donor retention goal and select which color you wish to use when displaying it
- +Show Reference Line: check
- Add: Select Group
Step Eight: Wonder at your new donor retention chart
Sit back and soak in the data beauty that is your new chart. Then call your mother and tell her what you've done. She'll be so proud of you. Plus you really need to talk to her anyway.
Possible Additions or Modifications
This Report displays data for the current year donor retention rate and acquisition of that cohort from the previous year. As mentioned in the recipe, we've also included custom fields and User Defined Rollups created that will allow you to create the same Report for up to four years back. To do so, just modify the Report Date Field filter to match the two years of interest and adjust the goal line, as appropriate.
Next Steps
We have a massive amount more to share on donor retention from Salesforce tips to stone-cold fundraising strategy. To get in on the fun, watch our free webinar, Achieve Dynamite Donor Retention with the Salesforce Nonprofit Success Pack.