Two essential metrics for measuring nonprofit fundraising success are a nonprofit's donor retention rate and donor churn rate. In this step-by-step recipe, we'll share a quick and easy way to calculate these vital statistics in the Salesforce Nonprofit Success Pack. In addition, we'll show you how to compare your current rates to your annual goal. What's more, we'll offer a method for dynamically calculating the number of retained donors needed to reach your annual goal, thereby providing a countdown to success for your development team to monitor.
For more on donor retention, watch our free webinar, Achieve Dynamite Donor Retention with the Salesforce Nonprofit Success Pack. We'll share key strategies for boosting donor retention as well as additional Salesforce Nonprofit Success Pack recipes for informing and motivating success.

Objective
Create a Report to calculate Donor Retention and Donor Churn for the current year
Estimated Time
30 - 40 minutes
Requirements
- Salesforce Nonprofit Success Pack
- Use of the Donations (aka Opportunities) object to track donations
- Rudimentary familiarity with creating custom fields and Reports in Salesforce
- Determination of your donor retention goal for the current year
NOTE: If you haven't determined this yet for your organization, you can still calculate your current donor retention and donor churn rates and ignore the portions below discussing your goal
Desired Outcomes
- Allow staff to view a Report that displays current donor retention rate and donor churn rate for the year
- Define a goal for donor retention and donor churn in the Report
- Display current rates vs. goals in the Report
- Allow for the display of the Report on the homepage in Salesforce Lightning
- Facilitate the display of the donor retention rate and donor churn rate in a Dashboard
- Calculate the number of individual donors who need to give this year to meet the donor retention goal and donor churn goal so this can be displayed on a Dashboard
The End Result
Donor retention is calculated by taking the total number of donors from last year and dividing it into the number of those same donors who donated this year. Donor churn is calculated the same way but by dividing the total from last year into the number of those same donors who haven't donated this year. We'll want to create our Report in such a way as to allow us to display both of these metrics in the Report itself while also allowing for a simplified snapshot of our key metrics in a Dashboard. We're also interested the displaying number of actual individuals in our cohort from last year who we still need to donate this year to meet our goals. That number will be tucked into our Report and featured more prominently in our Dashboard. In this recipe, we'll cover just the creation of the Report with the Dashboard discussed in our webinar.

Step One: Create a custom field on the Contact object
While there are a few different ways to create a Report to calculate the metrics we're after, not all easily lend themselves to displaying those metrics in a Dashboard based on the Report. To facilitate this, it will be easiest to add a custom formula field on the Contact object to aid in the creation of our Report. This formula is designed to result in 1 if the Contact donated last year and this year or 0 if the Contact donated last year but not this year. It need not be included on the Contact layout.
To create these fields in Salesforce Classic:
- Go to Setup
- In the left column, click Customize
- Click Contacts
- Click Fields
- In the Contact Custom Fields & Relationships section, click New
- For each step in the process, use the values in the Contact Object Custom Fields charts below to create the field
To create these fields in Salesforce Lightning:
- Go to Setup
- Enter "Object" in the Quick Find box in left column
- Select Object Manager under the Objects and Fields menu
- Scroll down the list and click Contacts
- Click Fields
- In the Contact Custom Fields & Relationships section, click New
- In the Fields & Relationship section, click New
- For each step in the process, use the values in the Contact Object Custom Fields charts below to create the field
Contact Object Custom Field
| Elements | Field Details |
|---|---|
| Field Label: API Name: Data Type: Formula: |
Gifts This Year and Last Year Gifts_This_Year_and_Last_Year__c Formula (Number) IF ( npo02__OppAmountThisYear__c > 0 && npo02__OppAmountLastYear__c > 0, 1, NULL) |
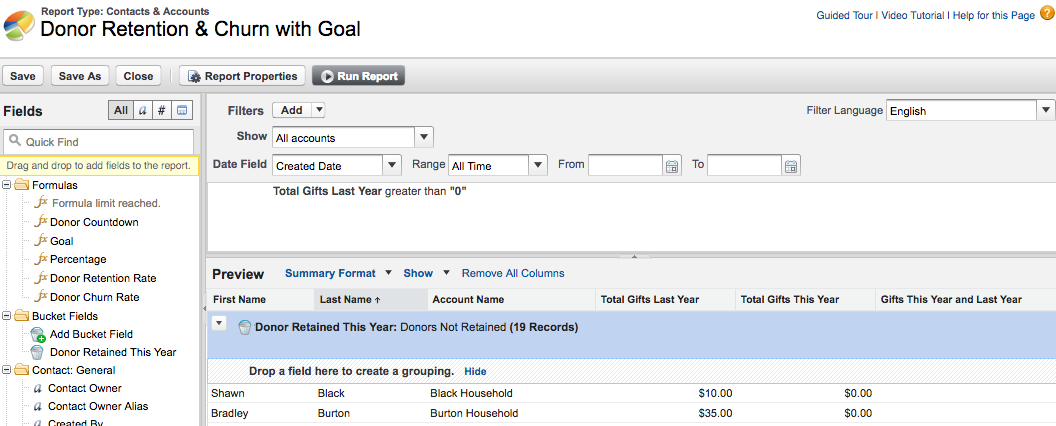
Step Two: Create a custom Report
With our Contact formula field created, we can create our Report. To create our Report, go to the Reports tab and click New Report fields in Salesforce Classic:
- Go to the Reports tab
- Click New Report
- For Select Report Type, choose Contacts & Accounts
- Click Create
- For Show, select "All Accounts"
- For Date Field > Range, select "All Time"
- Add
- In the new Filter form that appears:
- Choose "Total Gifts Last Year" from the field drop down
- Select "greater than" for the operator
- Enter 0 in the text field
- Click OK
- Click Save and enter in the following values in the popup window and click Save:
- Report Name: Donor Retention & Churn with Goal
- Report Unique Name: Donor_Retention_with_Goal_Progress
- Report Description: Calculate Donor Retention Rate and Donor Churn Rate This Year vs. Last Year along with Countdown of Donors Required to Meet Goals
- For Report Folder, select the folder of your choice
- Click Save
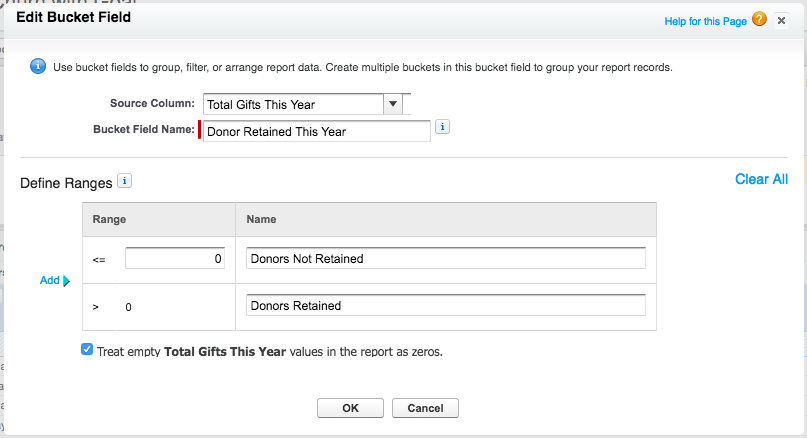
Step Three: Create a Bucket Field and use it to Summarize your Report
Next, we'll want to create a bucket field for our Report which we'll use to summarize the results. To create a bucket field, double-click Add Bucket Field in the Fields column on the left and enter the values in the screenshot, clicking Save when you're done. Note that the popup will change to match the screenshot once you select the Source Column.
Next to the Preview header, click Tabular Format and select Summary. Drag and drop your new Donor Retained This Year bucket field where it says "Drop a field here to create a grouping." Save your Report.
Step Four: Update Fields in the Report and Add Formulas
By default, your Report has a good many fields shown that we don't really need. You can eliminate all of those defaults except for First Name, Last Name, Account Name, Total Gifts Last Year, and Total Gifts This Year. Then, add your new Total Gifts This Year and Last Year field from Step One. After it's added, hover over it, click the drop down arrow, and click "Summarize this Field..." Tick Sum and click Save.
Next, create the following formulas by double-clicking Add Formula in the left column. Add each to the Report. IMPORTANT: Wherever you see 0.46, replace it with your donor retention goal and replace 0.56 with your donor churn goal.
Once added, save your Report again.
Report Formula Fields
| Elements | Field Details |
|---|---|
| Column Name: Description: Format: Where will...?: Formula: |
Donor Countdown Number of Donors Needed to Meet Goal Number, 0 Decimals Grand Summary IF ( ( RowCount * 0.46 ) - Contact.Gifts_This_Year_and_Last_Year__c:SUM > 0, ( RowCount * 0.46 ) - Contact.Gifts_This_Year_and_Last_Year__c:SUM, 0 ) |
| Column Name: Description: Format: Where will...?: Formula: |
Goal Goal for Donor Retention and Donor Churn Percentage, 2 decimals Grouping 1: Donor Retained This Year IF ( Contact.Gifts_This_Year_and_Last_Year__c:SUM > 0, 0.46, 0.54) |
| Column Name: Description: Format: Where will...?: Formula: |
Percentage Donor Retention Rate and Donor Churn Rate as a Percent Percentage, 2 decimals Grouping 1: Donor Retained This Year RowCount / PARENTGROUPVAL(RowCount, GRAND_SUMMARY) |
| Column Name: Description: Format: Where will...?: Formula: |
Donor Retention Rate Donor Retention Rate Percent, 0 Decimals Grand Summary Contact.Gifts_This_Year_and_Last_Year__c:SUM / RowCount |
| Column Name: Description: Format: Where will...?: Formula: |
Donor Churn Rate Donor Churn Rate Percent, 0 Decimals Grand Summary ( RowCount - Contact.Gifts_This_Year_and_Last_Year__c:SUM ) / RowCount |
Step Five: Modify the Report's Chart
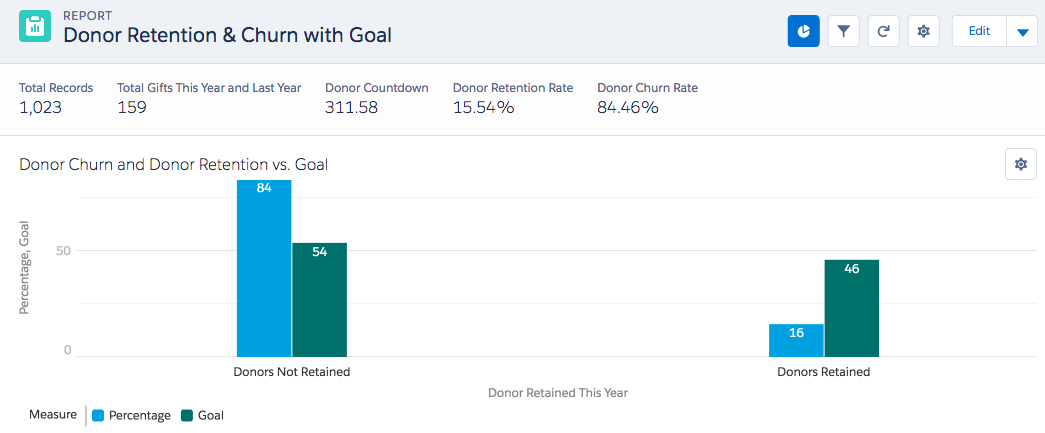
As a reminder from earlier, we're after the following as our Report chart, as seen in Salesforce Lightning:
To achieve this, edit the default chart and fill in the parameters like this:
- Chart Title: Donor Churn and Donor Retention vs. Goal
- Y-Axis: Percentage
- +Measure: Goal
- Show Values: ticked
- Legend Position: Bottom
Step Six: Run your Report for a sanity check
Run your report and spot check it. You'll see a number of duplicate data points between the Group 1 summary level and the Grant Summary. These allow us to display the data in the chart (Step Four) as well as pull key stats into the Dashboard we'll create as part of our webinar.
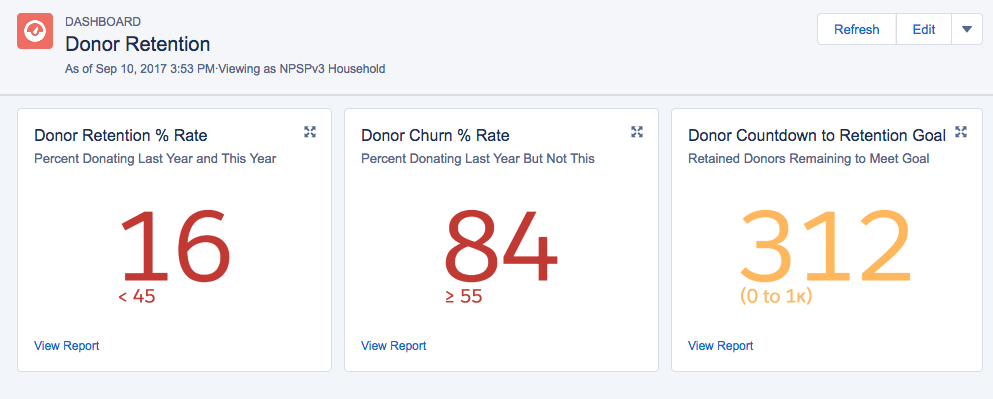
Next Steps
We have a massive amount more to share on donor retention including the adding of a Dashboard to display donor retention and donor churn rates as well as that donor countdown to track proximity to your goal in terms of actual human beings. To get in on the fun, watch our free webinar, Achieve Dynamite Donor Retention with the Salesforce Nonprofit Success Pack.
